Kubernetes Monitoring: Metrics, Challenges, and Best Practices
Kubernetes monitoring involves collecting metrics and logs from various components of the Kubernetes cluster and analyzing them to gain insights into the cluster's behavior.
What Is Kubernetes Monitoring?
Kubernetes is an open-source container orchestration system for automating deployment, scaling, and management of containerized applications. Kubernetes monitoring refers to the practice of monitoring the health and performance of a Kubernetes cluster or deployment.
Kubernetes monitoring typically involves collecting metrics and logs from various components of the Kubernetes cluster, including nodes, pods, and services, and analyzing them to gain insights into the cluster’s behavior. Some of the key metrics that are commonly monitored in a Kubernetes cluster include CPU usage, memory usage, network traffic, and disk usage.
In this article:
- The Importance of Kubernetes Monitoring
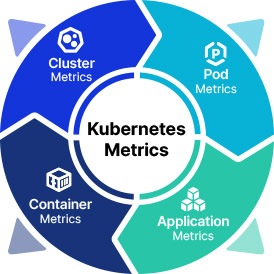
- Key Kubernetes Metrics to Monitor
- Cluster Metrics
- Pod Metrics
- Container Metrics
- Application Metrics
- Kubernetes-Monitoring-Challenges
- Kubernetes Monitoring Best Practices
- Choosing the Relevant Metrics
- Implement an Extensive Labeling Policy
- Preserve Historical Data
- Focus on the End-User Experience
The Importance of Kubernetes Monitoring
Kubernetes monitoring is essential for ensuring the availability, performance, and security of applications running on a Kubernetes cluster. Without monitoring, it can be difficult to detect and diagnose issues that can affect the cluster and its applications, such as resource constraints, network problems, or configuration errors.
Effective monitoring can help to identify and resolve issues before they impact the user experience, and can also help to optimize resource usage and reduce costs. For example, by monitoring resource usage metrics, such as CPU and memory utilization, it is possible to identify underutilized resources that can be reclaimed or repurposed to improve efficiency and reduce costs.
In addition, Kubernetes monitoring can help to ensure the security of the cluster and its applications by detecting and alerting on unusual behavior or activity that may indicate a security breach or vulnerability.
Key Kubernetes Metrics to Monitor
Here are some of the most common metrics that are used to monitor Kubernetes resources. For reference, see the official list of Kubernetes metrics.
Cluster Metrics
Cluster metrics are a set of measurements that provide insights into the health, performance, and resource utilization of a Kubernetes cluster. These metrics can be collected and analyzed to identify trends, troubleshoot issues, and optimize cluster performance.
Some examples of cluster metrics include node resource utilization, which measures the usage of CPU, memory, and disk resources on each node in the cluster; the number of nodes, which indicates the total number of worker nodes in the cluster; and the number of running pods, which tracks the number of pods that are currently running on the cluster.
Pod Metrics
Pod metrics are a set of measurements that provide insights into the behavior and performance of individual pods in a Kubernetes cluster. These metrics can be collected and analyzed to understand how pods are utilizing resources, identify issues, and optimize performance.
Examples of pod metrics include:
- Data about pod status, restarts, and readiness.
- Insights into CPU and memory usage, disk I/O, and network traffic for each container within a pod.
- Custom metrics that track specific parameters for applications running in containers, such as transaction volume, latency, and error rates.
Container Metrics
Container metrics provide insights into the behavior and performance of individual containers running in a Kubernetes pod. Some common container metrics include CPU usage, which measures the amount of CPU resources used by a container, memory utilization, which tracks the amount of memory used by a container, and network utilization, which measures the amount of network traffic sent and received by a container.
Application Metrics
Application metrics are a set of measurements that provide insights into the behavior and performance of an application running in a Kubernetes pod. Some common application elements to measure include application availability, which measures the percentage of time the application is available, application health, which tracks the application’s status and response time, and application performance, which measures the throughput and latency of the application.
Kubernetes Monitoring Challenges
Kubernetes monitoring can be challenging due to several factors, including the need to monitor both the overall health of the Kubernetes cluster and the individual workloads running on it. This requires collecting and analyzing metrics from a variety of sources, such as nodes, pods, containers, and applications, and integrating the results into a comprehensive view of the cluster’s performance.
Another challenge is the need for specialized monitoring tools that can collect and analyze Kubernetes-specific metrics, such as pod status, node capacity, and network traffic. These tools may require additional configuration and expertise to set up and use effectively, which can be a barrier for some organizations.
Security is also a critical concern when monitoring Kubernetes clusters, as many of the metrics and logs collected by monitoring tools contain sensitive data that must be protected. This requires careful consideration of security configurations, access controls, and data encryption to ensure that monitoring data is not vulnerable to unauthorized access or exploitation.
Kubernetes monitoring can be complex and resource-intensive, especially in large-scale environments with many nodes and workloads. This requires careful planning and optimization of monitoring workflows to ensure that monitoring does not negatively impact the performance or availability of the Kubernetes cluster or its applications.
Kubernetes Monitoring Best Practices
The following best practices can help organizations implement effective monitoring in Kubernetes.
Choosing the Relevant Metrics
Identifying the right Kubernetes metrics to monitor is essential for effective cluster management and troubleshooting. To identify the right metrics, it is important to start with a clear understanding of the objectives of the monitoring program and the key performance indicators (KPIs) that support these objectives.
Metrics should be selected based on their relevance to these KPIs, their ability to provide meaningful insights into cluster performance, and their impact on overall application performance. This requires a thorough understanding of the cluster architecture, application requirements.
Implement an Extensive Labeling Policy
Tags and labels are essential tools for organizing and managing resources in a Kubernetes cluster, such as nodes, pods, and services. By assigning tags and labels to resources, operators can easily identify and group related resources, and perform operations on them as a logical unit.
The main benefits of using tags and labels in Kubernetes are:
- Improved organization and management: Grouping related resources, such as pods running the same application or nodes in the same region, makes it easier to manage and operate on these resources.
- Simplified monitoring and troubleshooting: Operators can more easily monitor and troubleshoot performance issues, as well as isolate and fix problems.
- Simplified scaling and resource allocation: Tags and labels can be used to target specific resources for scaling or resource allocation, such as adding more nodes to a specific region or scaling up pods that are experiencing high demand.
It is important to establish a clear tagging and labeling strategy, including guidelines for naming conventions, scope, and usage. This requires collaboration between different teams and stakeholders to ensure that tags and labels are used consistently across the cluster and are aligned with business and operational goals.
Preserve Historical Data
Historical data can be used to identify trends and patterns and to perform retrospective analysis to understand and diagnose issues that occurred in the past. It can also be used to provide context and benchmarking information for future planning and decision-making.
It is important to establish a data retention policy that defines how long data should be kept, where it should be stored, and how it should be managed. This policy should consider factors such as data volume, access requirements, and compliance regulations, and should be aligned with the overall data management strategy for the organization. The data should be organized and indexed to enable easy searching and retrieval.
Focus on the End-User Experience
One of the main objectives of monitoring Kubernetes is to ensure that applications are performing optimally and meeting user expectations. Many Kubernetes users overlook the need to satisfy end-user expectations, focusing on issues that concern development or security teams.
By measuring metrics that are relevant to the end-user experience, such as page load times, transaction volume, and error rates, operators can gain insights into how the application is performing from the user’s perspective. This can help identify issues that may not be immediately visible from the infrastructure level, and provide a more holistic view of the application’s performance.