Kubernetes Dashboard: Ultimate Quick Start Guide
Learn how to navigate the Kubernetes Dashboard interface, perform common operations like monitor pods and clusters, and how to deploy a containerized application.
What is the Kubernetes Dashboard?
Kubernetes Dashboard is an official web-based user interface (UI) designed especially for Kubernetes clusters. The dashboard can display all workloads running in the cluster. It also includes features that can help you control and modify your workloads, and can display logs of activity on pods. You can also view basic resource usage on Kubernetes nodes.
In this article:
Enabling the Dashboard and Logging In
How Do You Deploy the Kubernetes Dashboard?
The Dashboard UI is not deployed by default. To deploy it, run the following command:
kubectl apply -f
https://raw.githubusercontent.com/kubernetes/dashboard/v2.3.1/aio/deploy/recommended.yaml
How Do You Log into the Kubernetes Dashboard?
In a terminal window, type kubectl proxy. Open a browser and visit the URL:
http://localhost:8001/api/v1/namespaces/kubernetes-dashboard/services/https:kubernetes-dashboard:/proxy/You should now see the Kubernetes dashboard deployed during cluster creation.
How Do You Access the Dashboard?
By default, Kubernetes deploys the dashboard with minimal RBAC permissions. The dashboard only supports access via a bearer token.
Here is how to create a new Kubernetes Service Account, grant admin permission, and provide access to the dashboard using the account’s bearer token. The code was shared in the Kubernetes documentation.
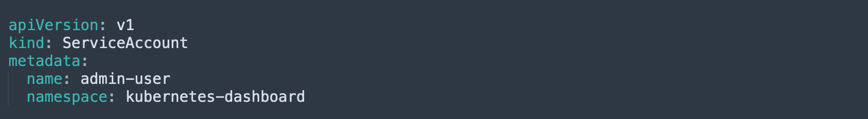
- Create a Service Account in the namespace
kubernetes-dashboard
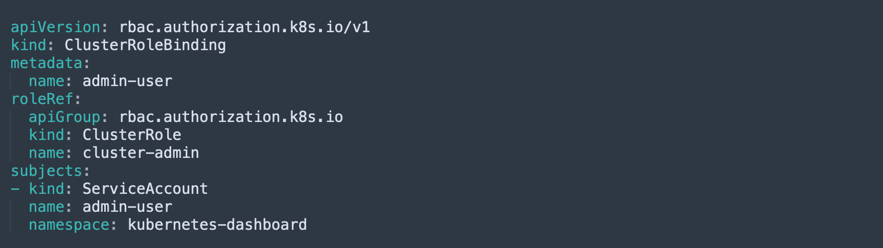
- We’ll assume a
cluster-adminClusterRole already exists in your cluster. Use the following code to bind the new account to it, using aClusterRoleBinding. If there is no such role, create it and grant the required privileges.
- Get a bearer token for the new account, which you can use to log in. Use the following command (in one line). The command uses the account name in the example above,
admin-user
kubectl -n kubernetes-dashboard get secret $(kubectl -n
kubernetes-dashboard get sa/admin-user -o
jsonpath="{.secrets[0].name}") -o go-template="{{.data.token |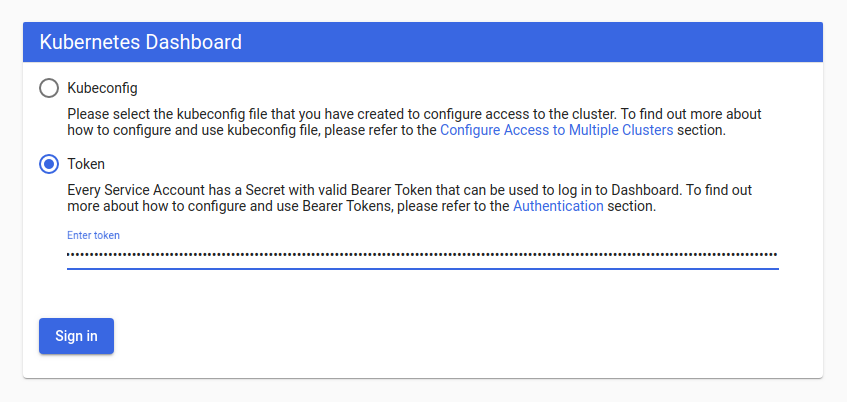
base64decode}}"- Copy the token from the console and paste it into the Enter token field on the Kubernetes Dashboard login screen. Click Sign in to log into the dashboard as administrator.
Kubernetes Dashboard Overview and Basic Operations
Let’s briefly review the main elements in the Kubernetes dashboard interface, and the operations you can perform in each of them.
Cluster View
This view lets you view data and perform operations at the Kubernetes cluster level. It includes the following sub-views:
- Namespaces—overview of cluster Namespaces. You can drill down into a namespace to see recent events related to resources within the namespace.
- Nodes—lists all Kubernetes nodes registered with the cluster. You can see labels, node status, and summary resource utilization data. You can drill down into a node to view more detailed information:
- Node details—including IP addresses, machine ID, operating system, and versions of the kubelet and kube-proxy running on the node.
- CPU and memory utilization—visualizes resources available on the node, limits and current utilization.
- Pod allocation—shows the total number of pods the node can run and the current utilization.
- Node conditions—displays error conditions like OutOfDisk, MemoryPressure, and DiskPressure.
- Pods—shows all the pods currently running on a node.
Related content: Read our guide to Kubernetes cluster ›
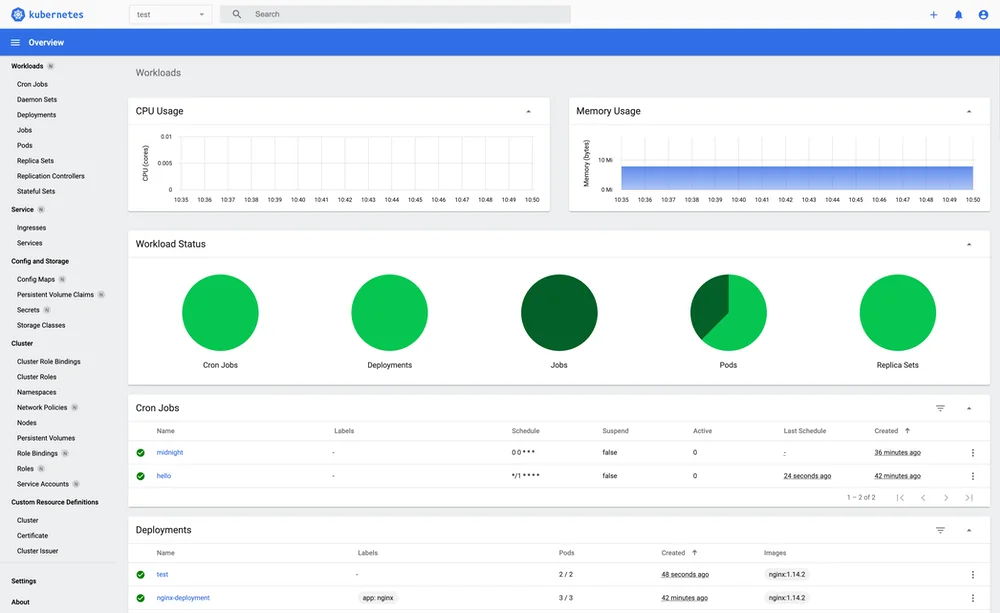
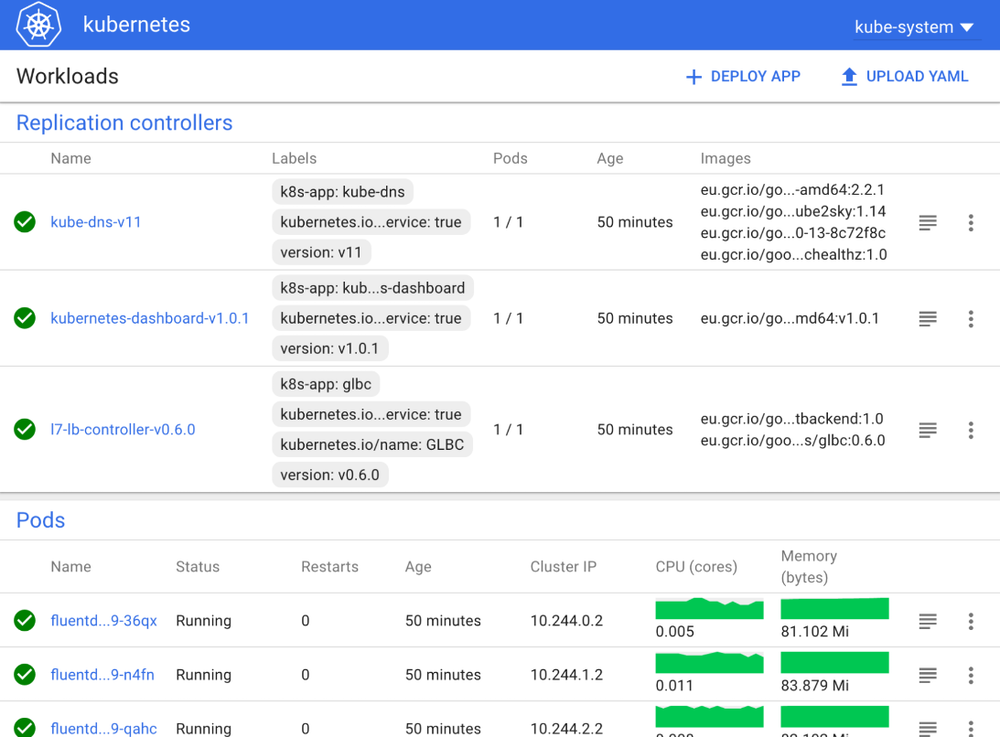
Workloads View
This view shows details on applications running in the Kubernetes cluster. It provides summary information about pods, including status and number of restarts, and lets you drill down into a pod to view more detailed information:
- Labels attached to the pod
- QoS class
- Containers running in the pod
- Controller that created the pod
- Events and Persistent Volume Claims (PVC)
Similarly, you can view detailed information about other Kubernetes objects like Deployments, Pods, ReplicaSets, and other Kubernetes controllers.

Related content: Read our guide to Kubernetes pods ›
Discovery and Load Balancing View
This view provides information about Kubernetes Services and Ingress objects, including the namespace the Service belongs to, labels, and Cluster IP. You can drill down into a service to view label selectors, a list of pods, endpoints and events related to the service.
Related content: Read our guide to Kubernetes services ›
Config and Storage View
Here is the information displayed by the Config and Storage view:
- Persistent Volume Claims—shows information about PVCs in the cluster, their status, storage volume, storage class, and allowed access modes. You can drill down into a PVC to view labels, annotations, namespace details, and capacity.
- Config Maps and Secrets—shows Kubernetes resources used for configuration of applications in the cluster. Lets you edit and manage configuration objects, and displays data in secrets (which is ordinarily not accessible within the cluster).
Related content: Read our guide to kubernetes ConfigMap ›
Deploying Containerized Applications with the Kubernetes Dashboard
Kubernetes Dashboard is not a read-only resource. You can use it to create and deploy containerized applications. To create Deployments and Services, you can use a simple wizard, providing information about the Deployment in one of two ways:
- By specifying the app details via the UI
- By uploading a JSON or YAML file that contains the required configuration
Here is how to create new deployments or services in the Kubernetes dashboard:
- In the upper right corner of the dashboard, click on the + CREATE button.
- Upload the (YAML or JSON) file containing the Deployment configuration, if you have created one for this purpose. Otherwise, specify application details as described in the table below. Items with an asterisk (*) are mandatory.
| Application name* | Specify the name of your application. Once you add this information, the wizard adds a label with the name to your Deployment and Service. You must choose a unique application name that does not conflict with any name in the chosen Kubernetes namespace. |
| Container image* | Add the URL of the container image. You can use a public container image from any registry or a private image. You must end the container image specification with a colon. |
| Number of pods* | Define a target number of pods the application should be deployed in. You must use a positive integer value. The wizard uses this information to create Deployments that maintain a target amount of pods across the entire cluster. |
| Service | You can use this option to expose a frontend Service of your application to external Services like public IP addresses. |
| Description | Any text you add to the description is turned into an annotation within your Deployment. It is displayed in the app’s details. |
| Labels | There are certain labels, like ‘application name’ and ‘version’ that are added by default. You can specify additional labels and apply them to your Deployment, Service, and pods. You can, for example, add labels like tier, environment, release track, and partition. |
| Namespace | A namespace is a virtual cluster. Kubernetes lets you deploy multiple namespaces that are backed by a single physical cluster. Namespaces enable you to partition your resources into logically named groups. |
| Image Pull Secret | Private container images usually require the use of pull secret credentials, which you can specify using this option in the wizard. The dashboard provides a dropdown list that displays all available secrets. The dashboard also lets you create new secrets. Successfully created mage pull secrets are chosen by default. Otherwise, image pull secrets are not applied at all. |
| CPU (cores) and memory requirement (MiB) | The default setting enables pods to run with unbounded memory and CPU limits. To limit resources, you need to specify a minimum resource limit for your container. |
| Run command and Run command arguments | A container runs a default entrypoint command that is specified in the image. You can override the default spec by using the command options and arguments. |
| Run as privileged | You can use this setting to specify if certain processes within privileged containers should be treated similarly to processes that run as root on a host. A privileged container can manipulate the network stack, access devices, and perform other actions. |
| Environment variables | To expose Services, Kubernetes uses environment variables. The values of environment variables can help you define environment variables or pass arguments to your commands. You can also use environment variables in applications to find Services. |
Securing Kubernetes Dashboard
The Kubernetes Dashboard is a valuable target for attackers, because it provides access to detailed information about your clusters, and can also make changes to Kubernetes deployments. Here are a few best practices for securing your Kubernetes Dashboard:
- Do not expose your dashboard service using a LoadBalancer – by default, the dashboard is only available from within your cluster. Using a LoadBalancer exposes it to the world.
- Do not provide excess privileges for the dashboard ServiceAccount – by default, the ServiceAccount used to authenticate to the dashboard has limited privileges on the cluster. Never grant this ServiceAccount root access on the cluster – even in development environments. This opens an easily exploitable backdoor into your Kubernetes cluster.
- Set Role Based Access Control (RBAC) – create well-defined RBAC rules for the ServiceAccount used by the dashboard and for dashboard user accounts.
Use OAuth2 authenticating proxy – here is an open source implementation you can use to enable OAuth2-based authentication for Kubernetes Dashboard users.